25.02.2026
Automating parts of Active Directory pentests with BloodHound CE
BloodHound is one of the essential tools for every Penetration Tester and Red Teamer and with the new release of BloodHound CE, BloodHound got some very nice and useful improvements. Even though BloodHound is most known for visualizing attack paths with graphs, a lot of information can be gathered by utilizing the underlying database directly. This blog post will show some examples on how the underlying database or the new API can be used to automatically find many basic weaknesses in an Active Directory environment.
The script is published on our Github repositoy bloodhound-adAnalysis. Feel free to reach out to me if you have any questions or feedback.
Automated Active Directory Analysis
Introduction
BloodHound is a tool we use in pretty much every pentest where we encounter an Active Directory (AD). It can visualize complex Active Directory structures, find possible attack paths and give a good overview of the environment. At the beginning of August, the new version BloodHound CE was released, coming with some new features and significant performance improvements. Some nice additions are the API and the deployment with docker. Another thing that changed is that there are no longer objects marked as high value instead they are marked as Tier Zero now. This is a nice improvement since now all Tier Zero assets are marked in the GUI which makes them easier to identify and more assets are marked compared to BloodHound Legacy. Tier Zero assets are defined by Specter Ops in this blog post as all assets which have control over enterprise identities and their security dependencies. Since it is still an early access release, some features are missing which will come in the future like importing custom queries. For some missing features, BloodHound Legacy can still be used, e.g. to mark objects as owned or clearing the database if the neo4j database port is forwarded from docker.
Currently, we are working on automating certain findings we often find during engagements, like disabled SMB signing or computers without LAPS. Playing around with BloodHound CE, I decided to start writing a simple Python script to automate some of those findings. Since there are now four ways to interact with BloodHound I think it makes sense to make a little comparison between them and showcasing the use cases for all of them.
BloodHound CE GUI / API
The BloodHound CE GUI is very nice for identifying attack paths or finding interesting targets. It gives an overview about all AD objects and their relationships between one another. For every object a lot of information is available and can be visualized, e.g. To what hosts can a user RDP to? What object controls does the user have? The biggest advantage of the GUI is visualizing longer chains and being able to easily see how each of the relationships in the chain can be exploited. BloodHound CE now works with an API in the background, which can also be used directly. The setup is very easy, and the provided python script gives a good base for working with the API. The API can also be tested and is documented inside the GUI which makes it very comfortable to get started.
Neo4j Web/Bolt Interface
Another way to access the BloodHound data is through neo4j directly. The data can't be visualized as with the GUI, but for certain use cases the raw text-based results are my preferred way. Additionally, there is the option in the web interface to export the data as csv-files which is very useful to provide the client with information regarding the affected resources, if there are many of them. One of my favorite use cases for neo4j is to skim over all descriptions (yes, that's a lot of data). Skimming over the AD descriptions can reveal some interesting information, e.g. what a host is used for or what technologies are used inside the company. This is not really feasible in the GUI since every object needs to be accessed individually. Accessing the data with neo4j (through the web or bolt interface) allows us to retrieve certain information more comfortable like the number of results with count() or only specific attributes which can be more easily written to a file, e.g. usernames for password spraying.
Practical Examples
Now let's get into the fun part of using BloodHound CE and see how we can automate some things.
Generating a list of users with specific criteria
Many tools are able to generate a list of users for a given domain but using the BloodHound CE API or the neo4j database instead has one big advantage: being able to filter for specific criteria. Based on specific criteria, we can filter for the most interesting users or users which will probably yield the most success. Our script generates 4 user files:
- enabledUsers.txt
- enabledTierZeroUsers.txt
- enabledInactiveUsers.txt
- enabledPotentialAdminUsers.txt
enabledUsers.txt will be generated using the following query:
This will simply filter out all disabled users. By filtering out the disabled users, we can drastically reduce the number of users we have to use during our next attack, e.g. password cracking. In a recent pentest, this reduced the number of users by over 50%. enabledTierZeroUsers.txt only contains the enabled Tier Zero users.
The query is rather simple due to the new system_tags attribute. This can be useful in combination with grep -f to look if the password of a Tier Zero user was cracked successfully. The enabledInactiveUsers.txt file is quite interesting since it contains enabled users with no login in the last 90 days. In many cases this means a user is not being used anymore (e.g. employee left the company) but since the user is not disabled the account can still be used. These users are good candidates for password attacks since there is a much smaller risk in locking them out in most scenarios. The query is a little more complex:
To check if a user can be considered inactive, we check the lastlogon and lastlogontimestamp attributes. Both attributes contain a timestamp from the last login, but lastlogon is the login against the DC which was queried during data collection and the lastlogontimestamp is the replicated timestamp from all the other DCs. Both values must be lower than a set threshold in this case: 90 days ago from the time of running the query. This has the side effect of potentially returning different data if the query is executed at a later time again.
enabledPotentialAdminUsers.txt contains all users where the name contains the substring adm which is often used in names for admin users or where the description contains the word admin. This should contain potentially interesting users which are not necessarily Tier Zero but could very likely have high privileges on some systems. All the shown queries only work with neo4j directly. Implementing this with the API is possible but requires additional steps in some scenarios. Let's take kerberoasting as an example and compare neo4j and the API.
API vs. neo4j database with kerberoasting as example
The default query for kerberoastable users in BloodHound is:
This is a very simple query, but note that the returned users include disabled users and the user krbtgt. We can use the following python code to request the same data with the API:
The response is some json-data containing all returned nodes with the following information:
- label: name of the node
- kind: type of node e.g. User
- objectId: object ID of the node
- isTierZero: true or false
- lastSeen: surprisingly this is not the last logon of the user, it's the date of ingestion; probably caused by the shared codebase with BloodHound Enterprise
In our current reporting style, the customer receives a csv-file containing all kerberoastable users with some additional information generated by the following query against the neo4j database:
With the API, we could get the same information except the serviceprincipalnames (SPNs). In order to get the SPNs with the API, we would need to request every kerberoastable user again to retrieve this information. The Python code would look something like this:
In the script used for automating this finding, the following function is used:
This function performs three queries to gather the following information:
- number of all kerberoastable users
- number of all Tier Zero kerberoastable users
- name, object ID, SPNs and system tag (Tier Zero) of all kerberoastable users
If we find kerberoastable users, we also generate the csv-file for the customer. In our version we also generate a PoC and a description for our report which is not included here.
Filtering targets for forced password changes
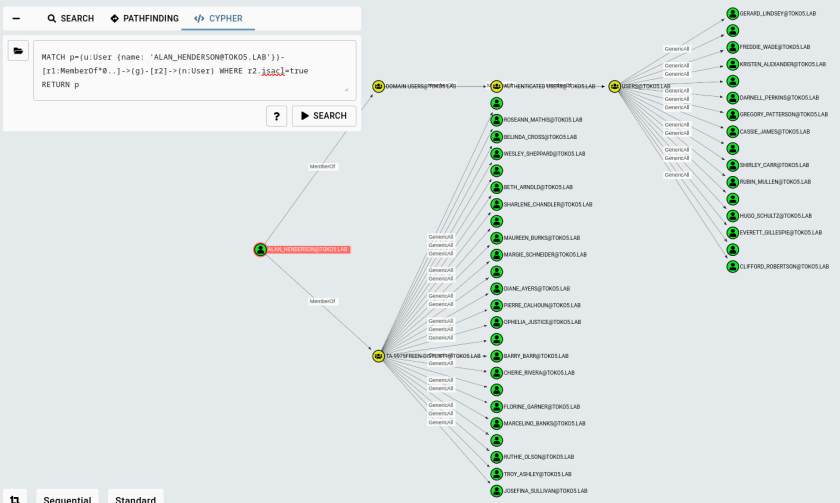
If we ask BloodHound CE how to abuse the GenericWrite edge it will tell us three possible attacks: Targeted Kerberoast, Force Change Password and Shadow Credentials attack. Depending on the circumstances, we may want to perform the Force Change Password attack but don't know what users are safe to attack since they may be active, and we disrupt the production of our client. Let's use cypher queries to check which users are potential candidates for this attack. In the BloodHound GUI we can see all outbound object controls in the node’s entity panel, but how do we filter them or show them if it's too many and the new safeguards prevent drawing the graph? The corresponding cypher query for the user ALAN_HENDERSON@TOKO5.LAB (and filtered for outbound control on only other users) is:

Sequential view of outbound object control
Ok, now we can append some filters we already used in other queries to find potential targets:
Now we can combine everything and search for the best candidates for a forced password change attack.
Since the AD for the test environment was generated, no login data is present and the result is the same as in the picture above. But in real environments, the results should have fewer results. Now we could look through all the returned users and identify the most interesting ones and change their password without worrying too much about locking a user from his account.
Uploading data with the new API
One good use case for the new API is to automatically upload the collected data into BloodHound. The basic function in Python can look something like this:
The dirToJson variable is a simple string containing the path to the json files without the trailing /, e.g. /customer/bloodhound. First, we must use the /api/v2/file-upload/start API endpoint to create a new file upload job. Then we upload our collected json files to /api/v2/file-upload/{file_upload_id} with the content of our json files in the body of the request. The needed file_upload_id will be returned in the /api/v2/file-upload/start response. After uploading all files, we have to notify BloodHound that the upload is done and the data can be ingested into the database. Now we periodically use the API endpoint /api/v2/file-upload?skip=0&limit=10&sort_by=-id and check if the status for the newly created job is Completed. After completing the ingetion we can start analysing the data.
Shortest paths to Tier Zero from owned user
The new Tier Zero tag allows us to extend our search for attack path even further, but since the query takes more time than e.g. Shortest paths to Domain Admins this often runs in a timeout. With small modifications to the Shortest paths to high value/Tier Zero targets it is possible to run this query with targeted starting points and hopefully finish before the timeout hits:
In this example, we set the starting point to a user with the name LISA_MASSEY@TOKO5.LAB, but we could also choose computer or group names. If we mark users as owned in BloodHound Legacy or with additional tools like CrackMapExec we can change the {name: 'LISA_MASSEY@TOKO5.LAB'} to {owned: true} and look from multiple starting points at ones. This could potentially lead to a timeout but allows us to find more potential attack paths.
Automated script
The provided script covers some basic findings we often encounter in our pentests and are easy to automate. Currently the following tasks will be performed:
- collecting basic information about total users, groups, etc. using the BloodHound API
- generating the different user lists
- checking if LAPS is enabled on all computer objects
- checking if computers have unsupported windows versions
- checking for inactive users and computers
- checking the age of the krbtgt password
- checking the number of sensitive users (Domain Admins and Tier Zero) and if they are in the Protected Users group
- checking if the guest account is active
- checking for kerberoastable and AS-REP-roastable users
- checking for active Tier Zero sessions
- checking for Kerberos Delegation (Constrained, Unconstrained and Resource-based Constrained)
- checking for DCSync for non Tier Zero objects
- generating a file with all descriptions
All these findings are primarily to identify missing best practices. These findings normally take a good amount of time during a pentest. Running all necessary tests manually and documenting them is painful. Automating this process as much as possible leaves more time during the engagement for compromising the AD or testing some other targets in greater detail. In order for you to run this script there are some steps to follow:
- setup BloodHound CE using the provided docker-compose files and enable the neo4j port
- generate the API token and download the current version of SharpHound from the GUI
- enter your API token (and the changed neo4j password, if applicable) into the script
- run SharpHound from a domain joined host
- extract the .zip archive
- run the following commands
The script will print out all the findings and write the files in the current directory. The following data will be written to the csv-files:
- laps.csv: computer name, computer objectid
- unsupportedOs.csv: computer name, computer objectid
- inactiveUsers.csv: username, user objectid, is user enabled (true or false), is user admin (true or false)
- inactiveComputers.csv: computer name, computer objectid, is computer enabled (true or false)
- domainAdmins.csv: username, user objectid
- tierZeroUsers.csv: username, user objectid
- kerberoastableUsers.csv: username, user objectid, user service principal names, user system tags (Tier Zero os NULL)
- asrepRoastableUsers.csv: username, user objectid, user system tags (Tier Zero os NULL)
- tierZeroSessions.csv: username, user objectid, computer name, computer objectid
- dcsync.csv: username, user objectid
- constrainedDelegation.csv: username, user objectid, computer name, computer objectid
- unconstrainedDelegation.csv: object name, object objectid
- resourcebasedConstrainedDelegation.csv: object name(allowed to act), object objectid(allowed to act), object name(target object), object objectid(target object)
Conclusion
The new BloodHound CE looks very promising and even though it's still in early access it has some nice improvements over the legacy version. The new API gives another way of interacting with BloodHound which can be used to automate some tasks or retrieve data in a text-based form to work with. The plans for future features also look very interesting, e.g. collecting and analyzing AD CS with BloodHound. While automating the basic tasks can significantly reduce the work during pentests some manual analysis still has to be done to identify more complex weaknesses. But having a little more time during an engagement allows us to take a deeper look at other components or playing through different attack scenarios like a privilege escalation to sensitive files or other critical systems.
Cheers,
Robin Meier